

Power Outage Board
Malibu averaged 14 days without power in two years. Where does your town rank?
Edison's average over the same two years: under half a day, 11.7 hours.
CA Lic. #949580 Office in Newbury Park Mon to Fri, 9 to 5
Your town's record
Find your town by ZIP code.
22 places ranked, plus 8 LADWP neighborhoods, Santa Barbara to Altadena. See the full ranking.
The average Malibu customer went 334.8 hours without power in 2024 and 2025, against 11.7 hours across Edison's whole system. Below are the 22 places County Line serves on Edison's grid, ranked from Edison's own reports, plus the 8 LADWP neighborhoods, with your ZIP code as the shortcut.
Two years at a glance
- 334.8 hoursMalibu, 2024 and 2025About 14 days for the average customer, 28.6 times Edison's average. Edison, City of Malibu, p. 4.
- 11.7 hoursEdison's whole system, 2024 and 20252.6 hours in 2024, 9.1 in 2025. Edison 2025 report, Table 1, p. 3.
- 3 placesOver 100 hoursMalibu, Topanga (Edison's 3rd District figure) and Calabasas.
- 20 of 20Lost more time in 2025 than in 2024Across Edison's whole system, January's major event days were 407.63 of 2025's 545.01 minutes. Edison 2025 report, Table 2, p. 4.
The ranking
Hours without power, 2024 and 2025 combined, every place ranked.
The average customer in each place, from Edison's reliability report for that place (p. 4 of each report). Edison's whole system averaged 11.7 hours over the same two years.
20242025Edison's average, 11.7 hoursTap a place for its full record.
Ranks 1 to 5: Malibu, Topanga, Calabasas, Oak Park and Moorpark
MalibuLos Angeles County334.8 hours
TopangaLos Angeles County128.2 hours
CalabasasLos Angeles County102.6 hours
Oak ParkVentura County52.0 hours
MoorparkVentura County49.6 hours
Ranks 6 to 10: Simi Valley, Agoura Hills, Thousand Oaks and Newbury Park, Hidden Hills and Altadena
Simi ValleyVentura County43.9 hours
Agoura HillsLos Angeles County42.7 hours
Thousand Oaks and Newbury ParkVentura County39.1 hours
AltadenaLos Angeles County34.5 hours
Ranks 11 to 15: Ojai, Westlake Village, Camarillo, Ventura and Montecito and Summerland
OjaiVentura County33.6 hours
Westlake VillageLos Angeles County26.4 hours
CamarilloVentura County20.6 hours
VenturaVentura County13.3 hours
Montecito and SummerlandSanta Barbara County10.3 hours
Ranks 16 to 20: Carpinteria, Beverly Hills, Santa Barbara, Oxnard and Santa Monica
CarpinteriaSanta Barbara County8.6 hours
Beverly HillsLos Angeles County7.7 hours
Santa BarbaraSanta Barbara County5.3 hours
OxnardVentura County5.2 hours
Santa MonicaLos Angeles County1.6 hours
Not ranked: Pacific Palisades, Bel Air, Brentwood, Encino, Studio City, Sherman Oaks, Tarzana and Woodland Hills. These City of Los Angeles neighborhoods are on LADWP, which reports one figure for its whole system: 8.7 hours in 2024 and 2025 (EIA-861), and has no wind shutoff protocol. The LADWP record.
The top of the list
Why do Malibu, Topanga and Calabasas lose power the most?
Edison's wind shutoffs: in 2025 they were the largest cause of outage minutes in every one of the 10 places at the top of this list, including Malibu at 61%, Topanga (Edison's 3rd District figure) at 69% and Calabasas at 79%. Each share is from that place's own Edison report (Edison, City of Malibu, p. 5, Edison, Unincorporated Los Angeles County, 3rd District, p. 5 and Edison, City of Calabasas, p. 5). A wind shutoff is Edison switching a circuit off on purpose ahead of high wind, and the power stays off until the wind drops and crews have inspected the line; wind shutoffs explains how they work.
The outages are long, not just frequent. The average Malibu customer had about 13 outages over the two years, which averages about 26 hours each (Edison, City of Malibu, p. 4, minutes divided by outages).
The bottom of the list
Which places lose the least power?
Santa Monica lost the least, 1.6 hours over the two years, then Oxnard at 5.2 and Santa Barbara at 5.3. In all three, the largest cause in 2025 was equipment failure, not wind shutoffs (Edison, City of Santa Monica, p. 5, Edison, City of Oxnard, p. 5 and Edison, City of Santa Barbara, p. 5).
At home
What do 100 hours without power mean in a house?
A hundred hours is just over four days. A closed refrigerator keeps food safe for about 4 hours without power, and a full freezer about 48 (FoodSafety.gov). The food is only the start: the internet, the alarm, the gate, the well or booster pump and anything medical that runs on a plug go off the moment the power does.
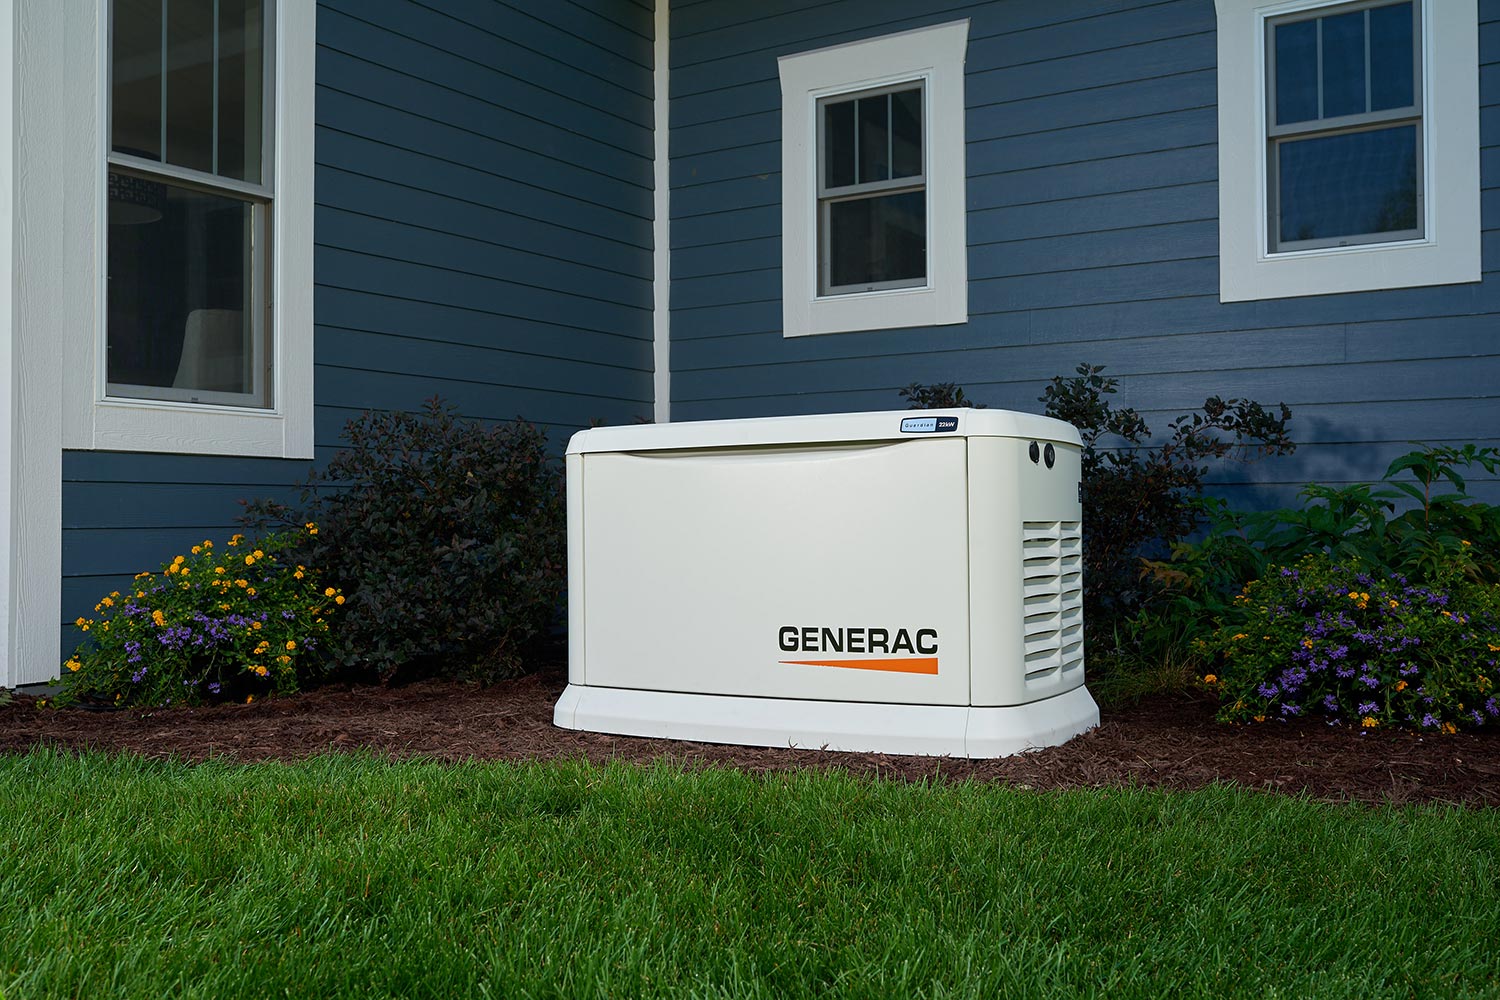
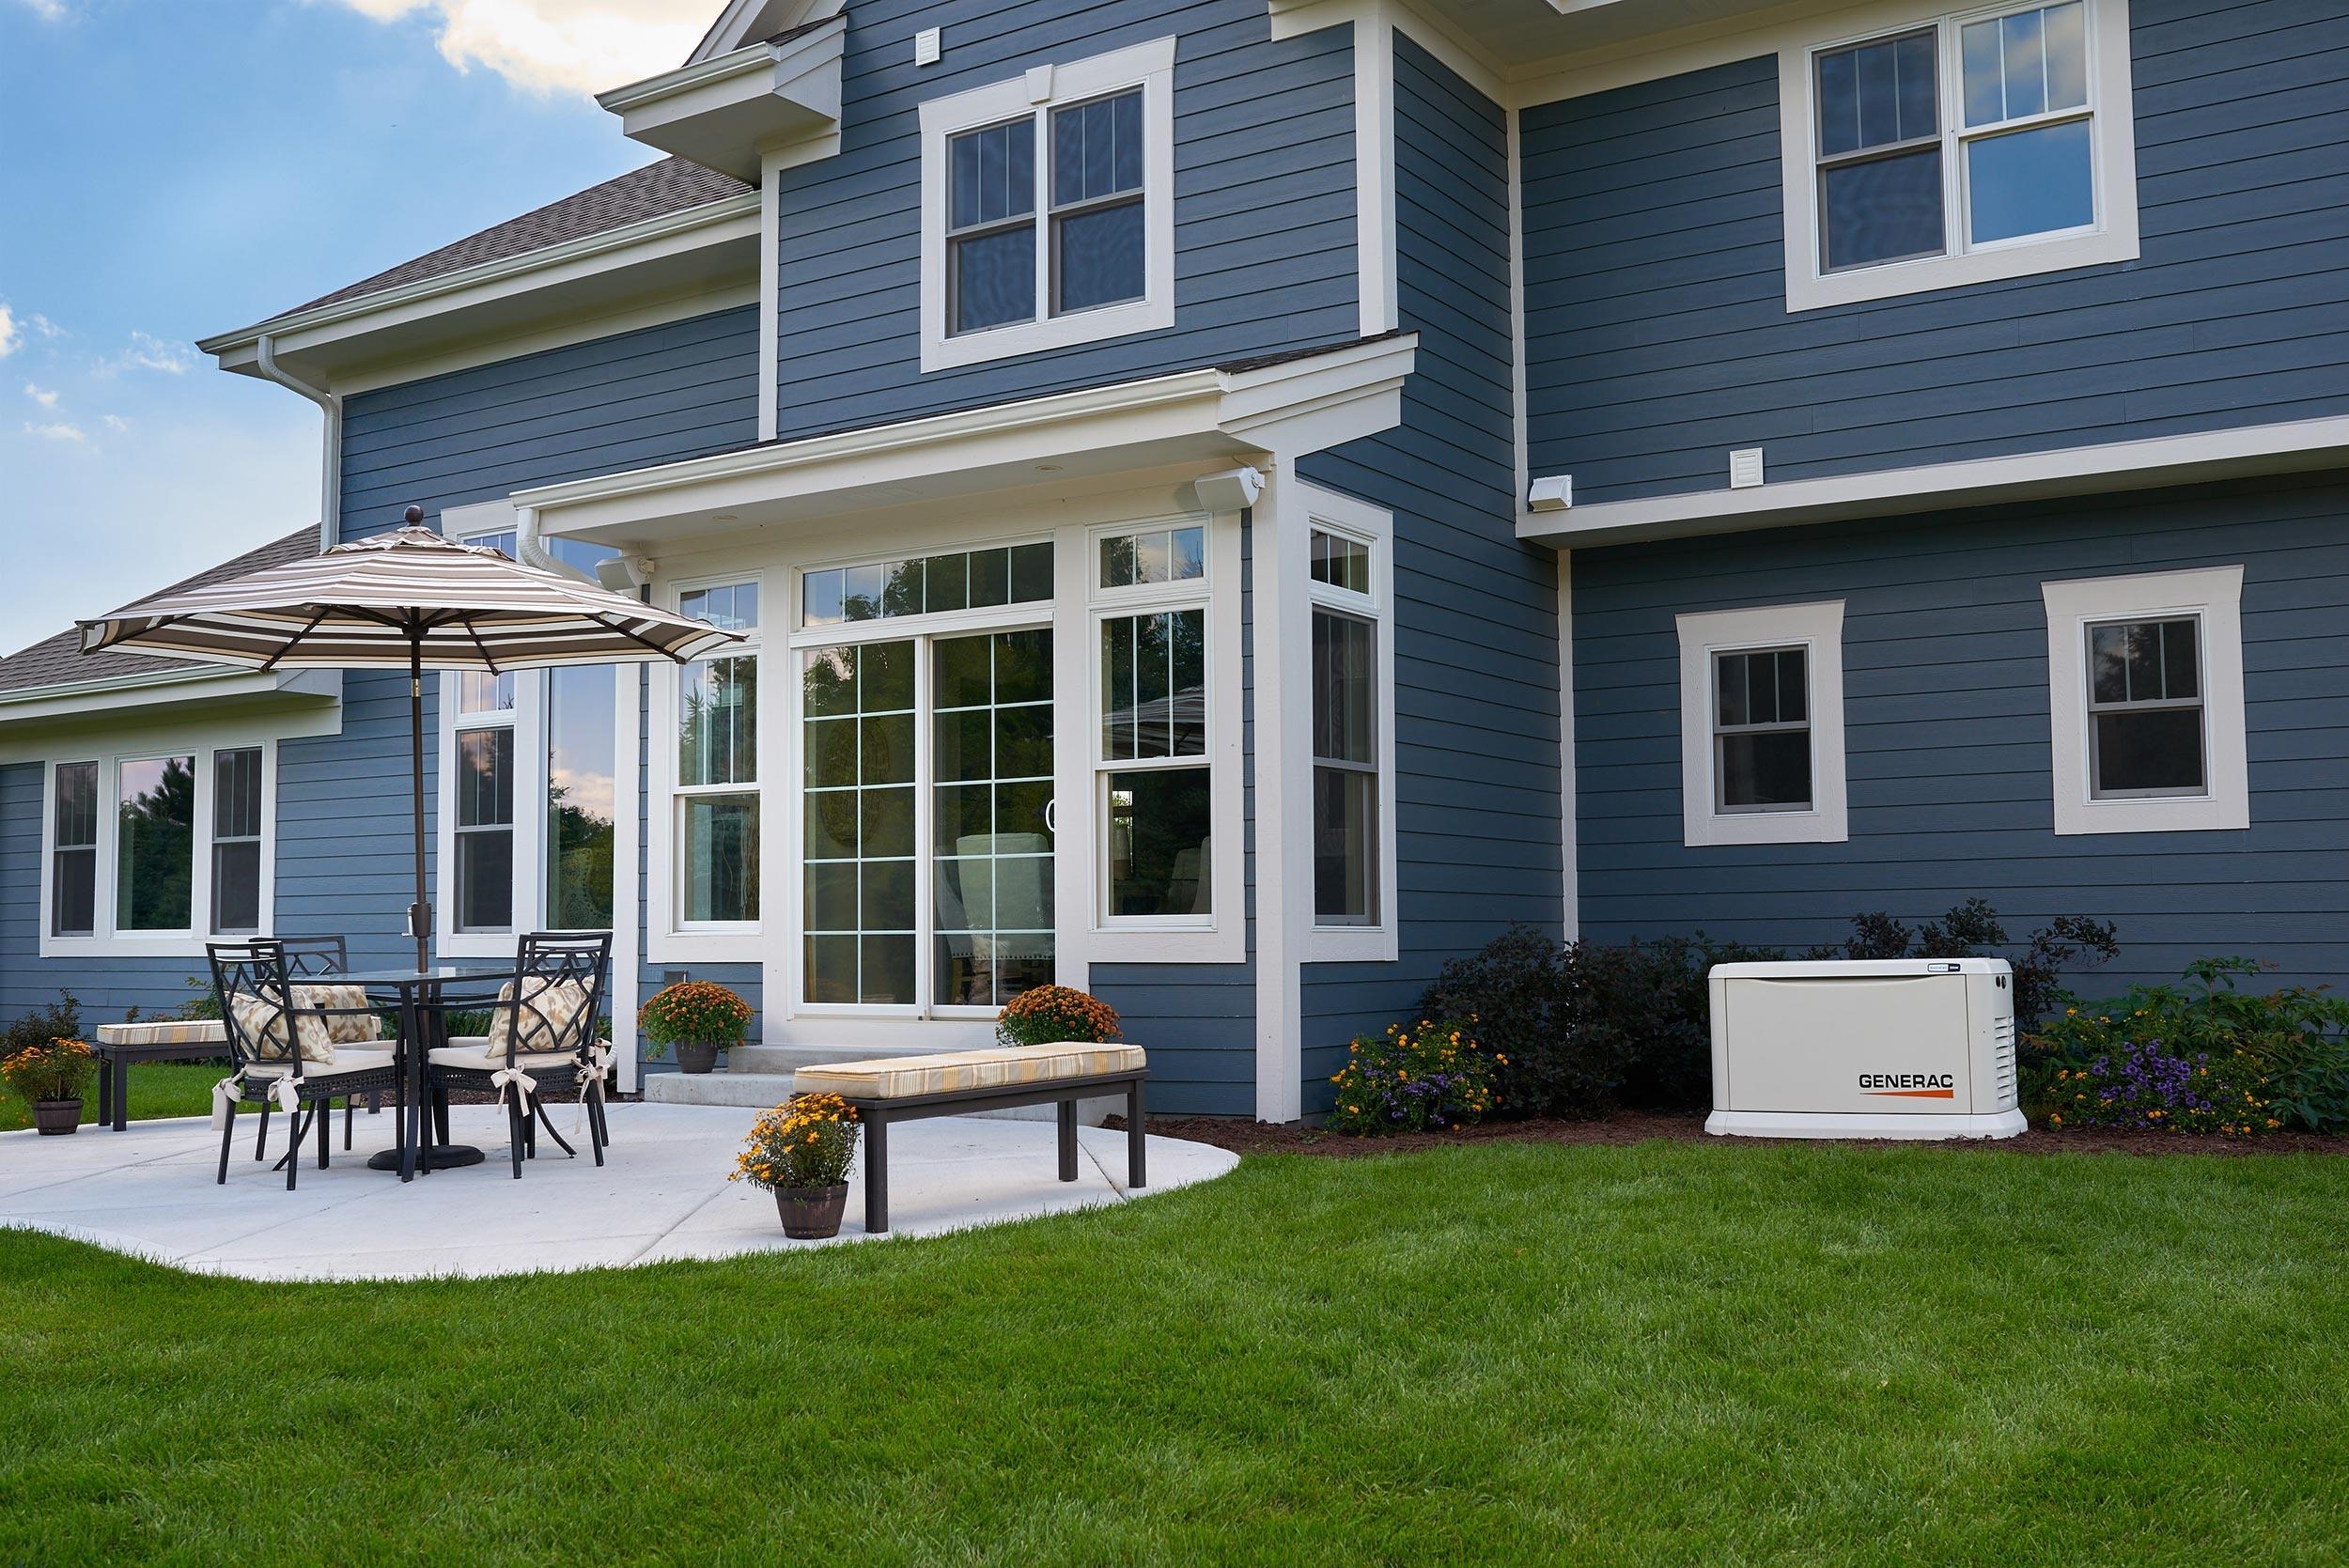
A standby generator with an automatic transfer switch takes the house over on its own, whether anyone is home or not, and carries it for days on natural gas or propane. What stays on shows what it carries, room by room. County Line Electric installs and services Generac standby generators in every place on this list.
The ranking: short answers
Which towns lose power the most?
Among the places County Line Electric serves, the five that lost the most power in 2024 and 2025 were Malibu (334.8 hours), Topanga (128.2 hours, 3rd District figure), Calabasas (102.6 hours), Oak Park (52.0 hours, 2nd District figure) and Moorpark (49.6 hours). Edison's whole system averaged 11.7 hours (Edison reliability reports by city, p. 4 of each).
Which town lost the most power in 2024 and 2025?
Of the places County Line Electric serves on Edison's grid, Malibu lost the most power: the average Edison customer there was without power for 334.8 hours over 2024 and 2025, about 14 days. That is 83.7 hours in 2024 and 251.1 in 2025, 28.6 times Edison's system average (Edison, City of Malibu, p. 4).
Which Ventura County place loses power the most?
Oak Park (Edison's 2nd District figure) ranks first in Ventura County among the places County Line serves on Edison's grid, with 52.0 hours in 2024 and 2025, 4th of 20 overall. Moorpark is next in the county with 49.6 hours (Edison, Unincorporated Ventura County, 2nd District, p. 4; Edison, City of Moorpark, p. 4).
Which Los Angeles County place loses power the most?
Malibu ranks first in Los Angeles County among the places County Line serves on Edison's grid, with 334.8 hours in 2024 and 2025, 1st of 20 overall. Topanga (Edison's 3rd District figure) is next in the county with 128.2 hours (Edison, City of Malibu, p. 4; Edison, Unincorporated Los Angeles County, 3rd District, p. 4).
Which Santa Barbara County place loses power the most?
Montecito and Summerland (Edison's 1st District figure) ranks first in Santa Barbara County among the places County Line serves on Edison's grid, with 10.3 hours in 2024 and 2025, 15th of 20 overall. Carpinteria is next in the county with 8.6 hours (Edison, Unincorporated Santa Barbara County, 1st District, p. 4; Edison, City of Carpinteria, p. 4).
Where do Thousand Oaks and Newbury Park rank?
Thousand Oaks and Newbury Park rank 8th of 20 places County Line Electric serves on Edison's grid, with 39.1 hours without power in 2024 and 2025, 3.3 times Edison's average. Newbury Park is part of the City of Thousand Oaks and shares its Edison report, where wind shutoffs were 83% of 2025's outage minutes (Edison, City of Thousand Oaks, p. 4; Edison, City of Thousand Oaks, p. 5).
How was this ranking made?
Each place's figure is Edison's SAIDI for that city or county district: the minutes the average customer was without power during the year, counting every outage over five minutes, wind shutoffs and major storm days included, scheduled maintenance left out. 2024 and 2025 are added together and shown in hours (Edison reliability reports by city, p. 4 of each). The method for each town, year by year, is on the Power Outage Board.
Where is the full record for my town?
Every place on the ranking links to its own page on County Line Electric's Power Outage Board, with the four years from 2022 to 2025, the 2025 causes and the wind shutoffs Edison filed with the state for November 2025 through October 2026. Type a ZIP code at the top of this page to jump to yours.
Where the numbers come from
Edison's own reports, and the federal file for LADWP.
Every figure on this page is read from these public documents and added up here.
- Southern California Edison: reliability reports by city and county district: minutes and outages per customer, 2022 to 2025, on p. 4; the 2025 causes on p. 5. One report per place on the ranking; each place's own page links its report.
- Edison Annual Electric Reliability Report, 2025 (PDF): the system averages, Table 1, p. 3.
- U.S. Energy Information Administration, Form EIA-861: LADWP's 2024 and 2025 figures. LADWP Wildfire Mitigation Plan: no wind shutoff protocol.
- FoodSafety.gov: food safety during a power outage: the refrigerator and freezer times.
Next step
Get off this list. Keep the house on.
Name, phone, city and what you want to keep running. The office calls back to schedule a site visit.
Or call (805) 499-0823. Monday to Friday, 9 to 5.